 Assuming you already have MAMP working (with at least one website) on your local Mac computer, and you are using Aptana, you can follow along with getting XDebug working too. Note: It is possible to setup XDebug on XAMPP with Aptana (Windows) but this walkthrough uses MAMP as an example instead.
What is XDebug?
XDebug allows you to “step through” PHP code as it executes; you can see exactly what values PHP variables hold at any given moment. XDebug is an invaluable tool in debugging code and figuring out where an error occurs or where code logic needs to be adjusted. It’s the bee’s knees.
Setup Steps
- Check which PHP version your Apache uses View Step
- Configure php.ini View Step
- Verify that you successfully configured php.ini View Step
- Configure your IDE (Aptana) View Step
- Get the Helper Browser Extension View Step
- Confirm Setup Success (Set a Breakpoint) View Step
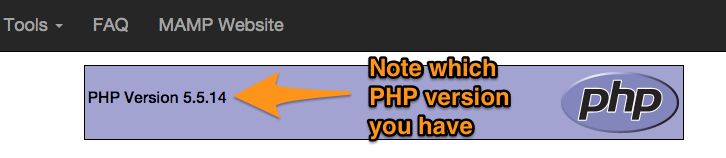
Check which PHP version your Apache uses
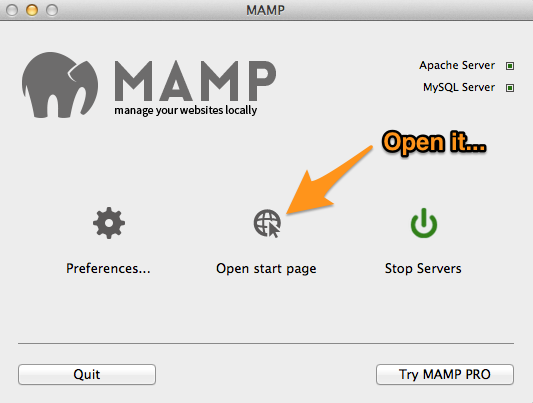
and then…
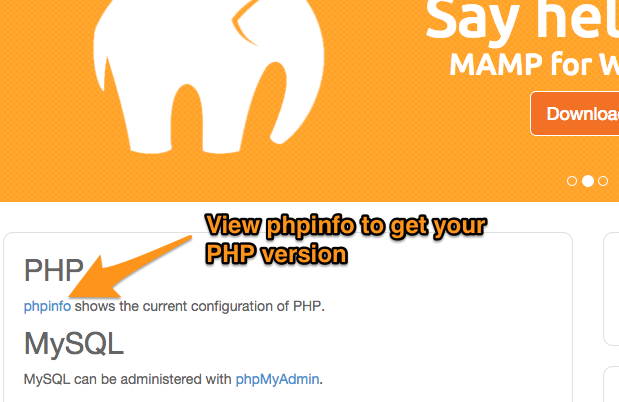
and then…
Configure php.ini
You will need to use the PHP version from the previous step to find out which php.ini file to edit. For example, I will edit the .ini file for my version, 5.5.14. You may edit the .ini file for a different version depending on your version of PHP.
The path to the php.ini file will look similar to this:
/Applications/MAMP/bin/php/php{YOUR-VERSION}/conf/php.ini
For example:
/Applications/MAMP/bin/php/php5.5.14/conf/php.ini
In php.ini, find the heading, [xdebug].
Directly under this [xdebug] heading, you should see a line that begins with “;zend_extension=…”.
Remove the comment from the beginning of the “;zend_extension=…” line to activate it.
The full line will have a different path depending on your PHP version so don’t worry if your line isn’t exactly the same:
[xdebug]

zend_extension="/Applications/MAMP/bin/php/php5.5.14/lib/php/extensions/no-debug-non-zts-20121212/xdebug.so"
Now that the built-in debugger is activated, you will have to add in a few more configuration lines.
All-together, your [xdebug] section should look like this:
[xdebug]

zend_extension="/Applications/MAMP/bin/php/php5.5.14/lib/php/extensions/no-debug-non-zts-20121212/xdebug.so"

;xdebug.default_enable=1

xdebug.remote_enable=1

xdebug.remote_handler=dbgp

xdebug.remote_mode=req

xdebug.remote_host=127.0.0.1

xdebug.remote_port=9000

;xdebug.remote_autostart=1
Verify that you successfully configured php.ini
Before your configuration changes can take effect, you must turn off MAMP, then turn it on again.
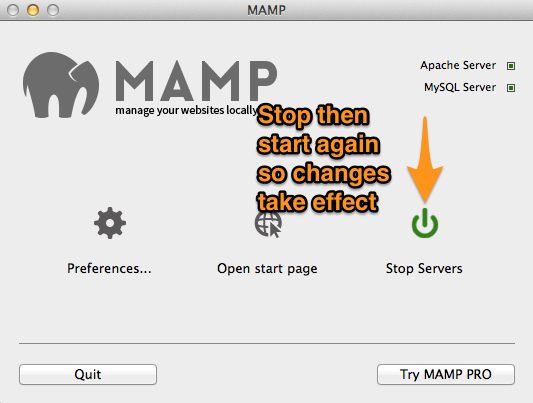
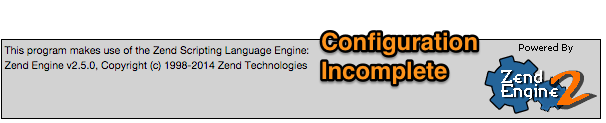
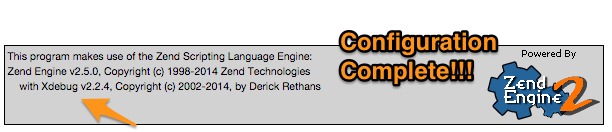
Remember the phpinfo page that you accessed in the first step?. Refresh this page. If you successfully configured the php.ini file, then you should see something similar to the following on your phpinfo page:
before…
after…
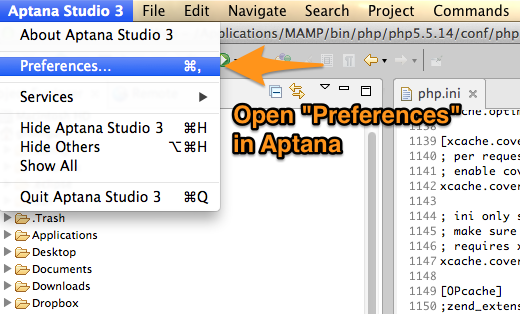
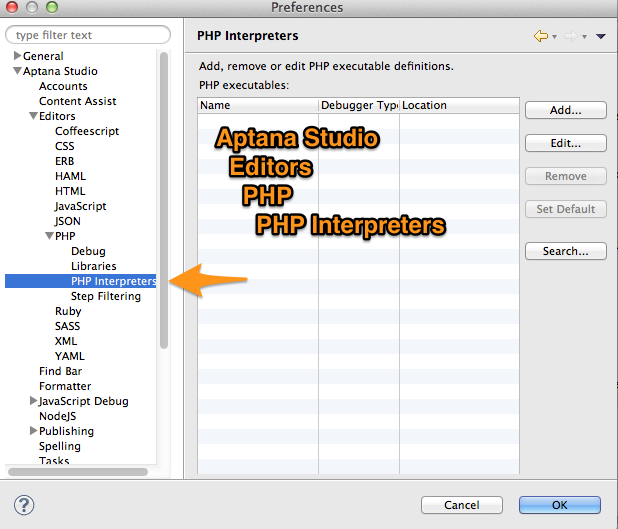
Configure your IDE (Aptana)
So far, the configuration steps have been pretty generic. But the next step will be more specific depending on the IDE you are using to edit code. This example will cover configuring Aptana, specifically.
Configure PHP Interpreter
and then…
and then…
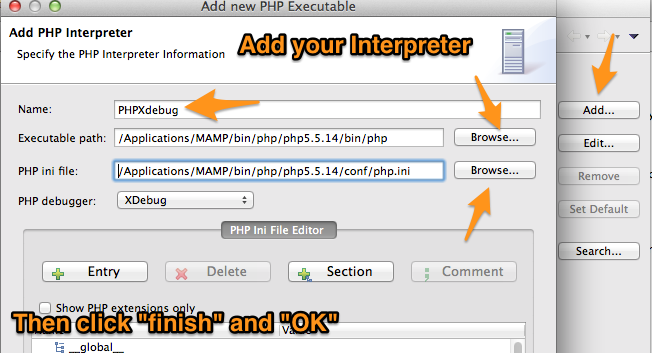
Your “Executable path” may be different depending on your version of PHP. But, my path is:
/Applications/MAMP/bin/php/php5.5.14/bin/php (Unix Executable File)
Your “PHP ini” file path may be different depending on your version of PHP. But, my path is:
/Applications/MAMP/bin/php/php5.5.14/conf/php.ini (This is the file you configured earlier)
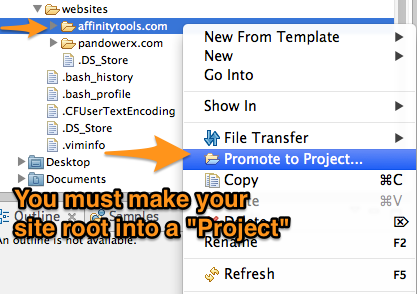
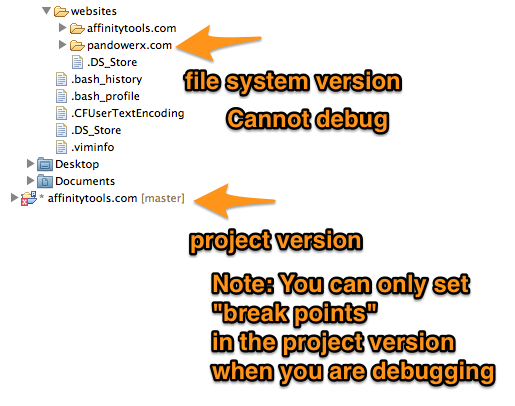
Configure local site as a “Project”
In order for Aptana to recognize a local website as a debuggable thing, you must first designate it as a “Project”:
In Aptana’s “Project Explorer” tab, navigate to your website’s root folder, then right click…
and then…
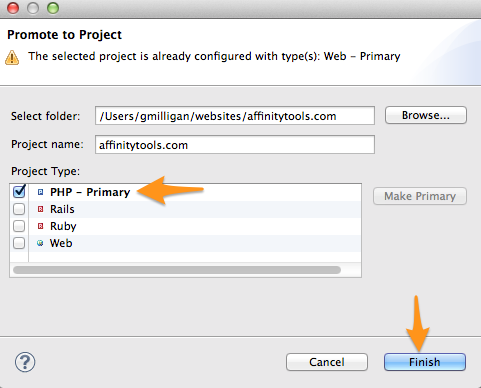
and then a “project” version of the web site is created in Aptana…
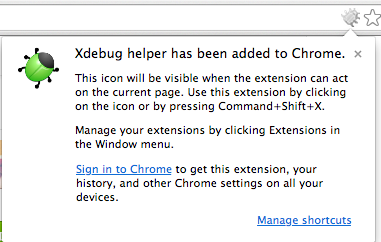
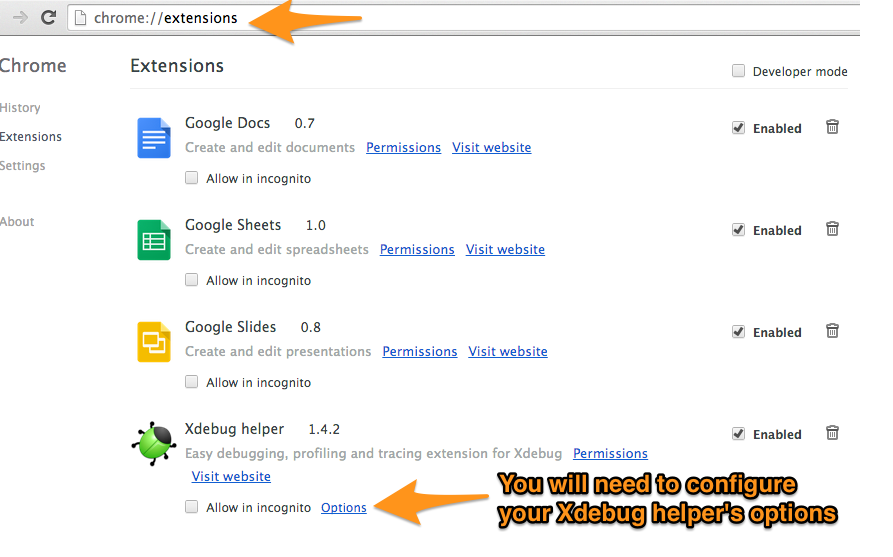
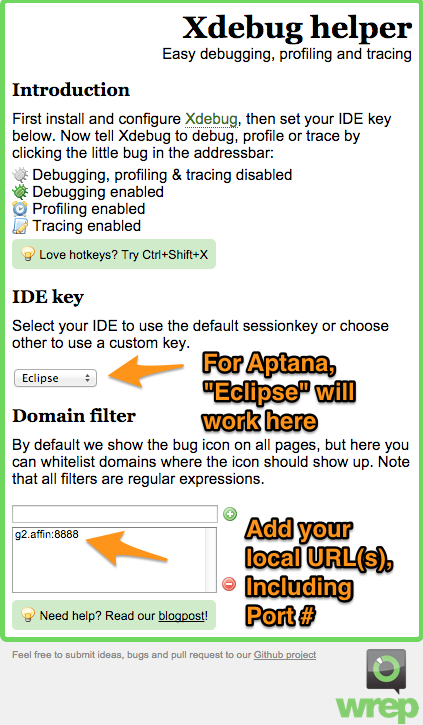
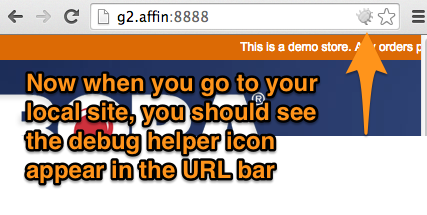
Get the Helper Browser Extension
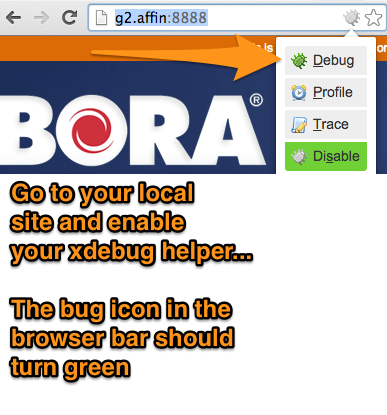
Now that Aptana is configured, you will download a helper extension that will aid you in turning debugging on and off. This help extension also helps you control which local web site URLs have debugging enabled.
You can get this extension here: install XDebug Helper for Chrome
and then…
and then…
and then…
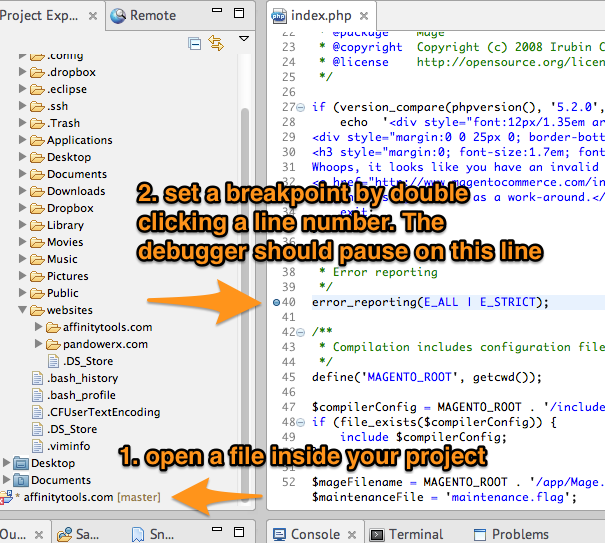
Confirm Setup Success (Set a Breakpoint)
Here’s the moment of truth. Test what you’ve done to make sure it’s working. You should be able to set a breakpoint anywhere in your local project (website) and have the debugger hit it. Let’s try it:
and then…
Now, when you refresh your browser page (the website with xdebug helper activated) you should “hit” the breakpoint that you set:
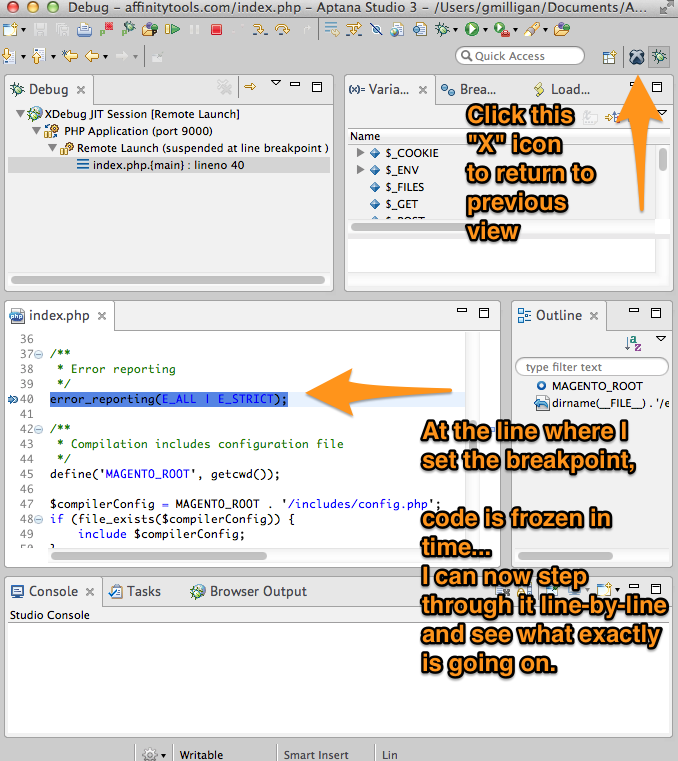
After clicking through the popups, you should see something like the previous screenshot. Success! This walk through is over. Peace out.