Top 5 Metrics for Organic Website Performance Monitoring
As data analysis and organic health become increasingly vital to the performance of your eCommerce presence as a whole, learning how to sift through the endless stream of metrics and data sources can make your head swim. And even harder – knowing what these independent performance indicators mean when reviewed next to another, or against your business goals, can leave you drowning in a pool of percentages.
But we can throw you a life preserver! Let’s explore the top 5 metric comparisons that will provide you, as an SEO or website manager, with the most value in defining actionable items that have a direct impact on website performance when reviewed monthly.
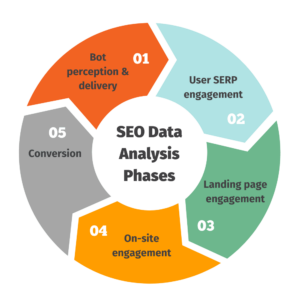
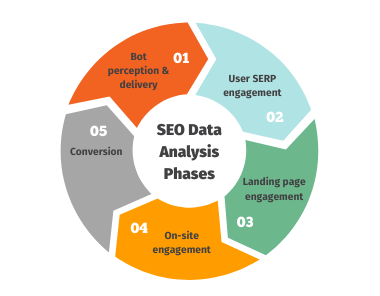
From the bird’s eye view, SEO data analysis is cyclical. Look at it from these phases and you’ll be spot on every time:
- Bot Perception & Delivery
- User SERP Engagement
- Landing Page Engagement
- On-Site Engagement
- Conversion
Now, let’s dive in to what that means:
Phase 1: Bot Perception & Delivery
Metrics: Page Experience Errors
Data Source: Google Search Console & SEMRush
Investigation: Organic engagement with your domain begins long before a user even sees a URL in the search results. That’s because their browser history is used by search engines to define what content will be most relevant to them as an individual, and what domain will provide the best user experience. This perception of health from the bot perspective is the first consideration of website performance.
Actionable Items: Define technical errors identified by search engines that are negatively impacting the user experience.
Phase 2: User SERP Engagement
Metrics: Non-Branded Keyword Ranking Trends
Data Source: Google Search Console, SEMRush (or other Keyword Research Tool)
Investigation: The user begins their organic interaction with your domain in the SERP. If you’re trying to reach an audience who isn’t already aware of your brand, you have to target relevant, non-branded keywords that will speak to that audience. And it all starts with reviewing the non-branded keywords.
Actionable Items: Improve metadata content strategy to rank for relevant, quality keywords that will assist in driving traffic from the SERP to the best pages for that query.
Phase 3: Landing Page Engagement
Metrics: Landing Page Pageviews vs. ECR, Landing Page Pageviews vs. Exit Rate
Data Source: SEMRush (or other Keyword Research Tool)
Investigation: The next step of the user’s journey is on the page they land when clicking through from the organic search results. It is here that the user is given the first opportunity to engage with your content, and (hopefully) convert. This conversion is dependent on your goals and can be anything from purchase to email signup. But no matter your goal, bettering the chances of that engagement starts with targeting relevant keywords that match the intent of the page with the intent of the user.
Actionable Items: Update your on-page content strategy to target keywords that match the intent of the user to the intent of the page. For example, if it’s a product page, update content to target keywords that have SERP features like reviews and rich snippets, and where other products rank. Avoid targeting keywords on product pages that have informational pages ranking, and SERP features like featured snippets, video carousels, and knowledge panels.
Phase 4: On-Site Engagement
Metrics: Sessions vs. Pages per Session vs. Avg. Time on Page vs. Bounce Rate vs. Conversion Rate, Heatmaps, Recordings
Data Source: Google Analytics, HotJar
Investigation: If a user engages with landing page content they have likely found what they were looking for OR find something engaging about your website – enough to further their search. That is because of UX. The usability of your website has to be addressed and analyzed to improve conversion – and this ultimately circles back to organic rankings. Does the bounce rate increase at the same rate as sessions and pages per session? Your users might be struggling to find what they’re looking for. Does the avg. time on page increase while sessions and bounce rate decline? It’s possible you are refining your audience and the decline in sessions is a good thing. Are users trying to click an image that isn’t hyperlinked?
Actionable Items: Review how users navigate through your site after engaging with the initial content. Compare the metrics to each other and then review the data against the real-time engagement captured with HotJar recordings and heatmaps.
Phase 5: Conversion
Metrics: ECR, Abandoned Cart Rate, Individual Product Performance
Data Source: Google Analytics, HotJar
Investigation: Conversion is the final measure of performance. If a user finds what they are looking for and are provided a good experience, they convert. This shows trust in the domain and the brand, and is a major indicator to search engines of an organically healthy website that will likely be served in SERPs. But if users are unable to convert, or choose not to, search engines are less and less likely to serve those pages, and ultimately, your domain.
Actionable Items: Review the conversion path. If a user isn’t converting, why? Where do they drop off? If you can isolate the problem, you are more likely to understand how to solve it, and improve bot perception of your domain. Which brings us back to the first phase of the organic website performance data analysis cycle!
At Human Element, we perceive organic performance monitoring as a key component of a successful eCommerce strategy. Without an understanding of how users and bots engage with your domain, you have no visibility into how to improve it.